 Genzee
What Is Your Ideal Weight? What the Formulas Really Say
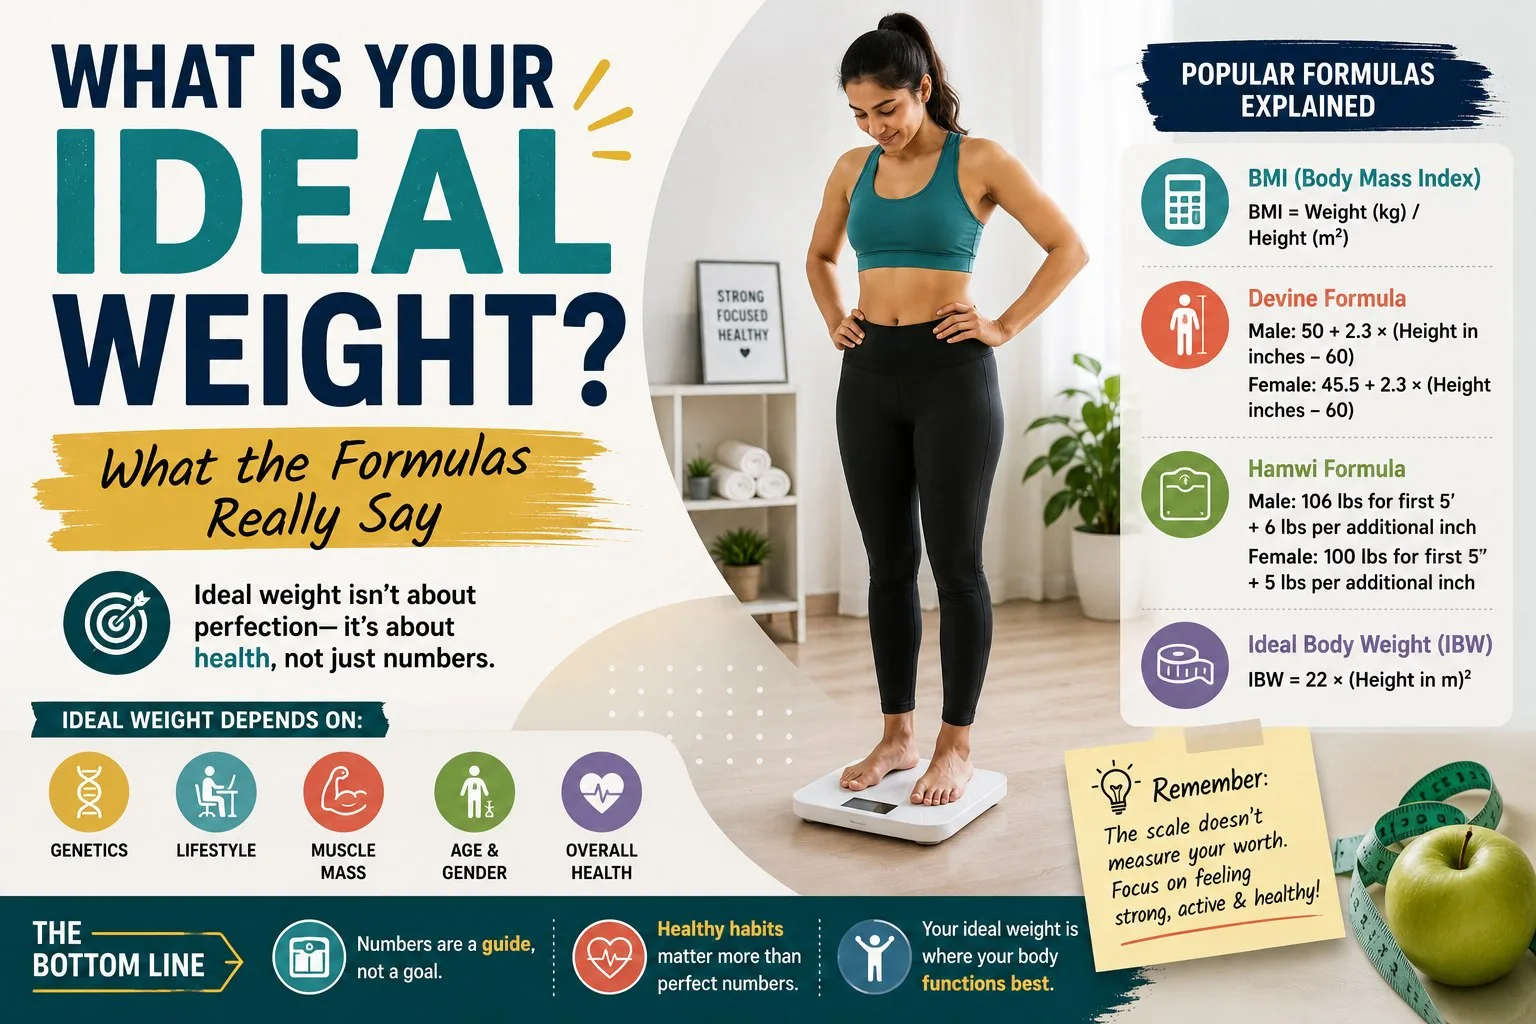
Type your height into any "ideal weight" tool and it will hand you a number with unearned confidence — 70.5 kg, as if a decimal place settles the matter. The truth is more interesting: the famous formulas were invented for other purposes, they disagree with each other by design, and modern evidence supports a range rather than a point. Knowing where the numbers come from is the best protection against taking any single one too seriously.
Where the formulas actually come from
The Hamwi formula (1964) was a physician's quick rule of thumb for estimating body weight in clinical conversation. The Devine formula (1974) — today's most-quoted "ideal weight" — was published to standardise drug dosing: medications like certain antibiotics dose better against lean body estimates than total weight. The Robinson formula (1983) refined Devine against insurance mortality tables. None of the three was ever validated as a health target for the general public; they escaped the hospital and became internet folklore. All share one structure:
Devine men: 50 + 2.3/inch · Robinson men: 52 + 1.9 · Hamwi men: 48 + 2.7
For a 175 cm man they give 70.5, 68.9 and 72.0 kg respectively — a 3 kg spread on identical inputs, which tells you the precision on offer. See all four references side by side for your height in the ideal weight calculator.
The modern answer is a range: BMI 18.5–24.9
Population studies link the lowest overall health risk to a band of weight-for-height, not a point — the healthy BMI range. For 175 cm that spans 56.7 to 76.3 kg: a twenty-kilogram corridor in which the formula values are just three points among many healthy ones. The band's message is liberating and boring at once: there is no single ideal weight, only a generous zone plus individual factors. Find your own band with the BMI calculator, and read what BMI can and can't tell you for the tool's honest limits.
What every formula misses
- Composition. A muscular 80 kg and a sedentary 80 kg at the same height are different bodies with different risks. The scale can't see the difference; the formulas can't either.
- Fat placement. Abdominal (visceral) fat drives metabolic risk far more than weight itself. Waist measurement — aim below half your height — often predicts better than any weight figure.
- Ancestry. South Asians develop diabetes and heart disease at lower BMIs than Europeans; risk guidance for us often starts at BMI 23, not 25. For Pakistani readers, the practical translation is: aim for the middle of the healthy band rather than its ceiling.
- Age and frame. Slightly higher weight in older adults is not automatically worse (muscle preservation matters more), and frame size legitimately shifts healthy weight within the band.
A better question than "what's my ideal weight?"
Ask instead: what weight can I reach and hold with habits I don't hate, at which my health markers are good? In practice:
- Locate yourself: BMI band + waist measurement, two minutes total.
- If change is warranted, set a process target, not a scale fantasy: 5% of body weight in 3–4 months is the evidence-backed first milestone — it measurably improves blood pressure, sugar and lipids even while "ideal" remains distant.
- Run the mechanism: a moderate calorie deficit via the calorie calculator and the deficit guide, protein and resistance work to keep muscle.
- Judge by trend and bloodwork, not by distance from Devine's dosing constant.
The formulas earn their keep as historical references and clinical shorthand — and the calculator shows them honestly, spread and all. But the ideal weight worth pursuing was never a number on someone else's chart; it's the healthy band, entered at a sustainable pace, and held. That target, unlike 70.5 kg, survives contact with real life.
Beyond weight: the numbers that predict better
If the goal behind "what's my ideal weight?" is actually "am I healthy, and what should I change?", several cheap measurements outperform the scale. Waist circumference (at the navel, relaxed): South Asian risk guidance flags 90 cm for men and 80 cm for women — visceral fat is the metabolically dangerous kind, and the waist sees it while BMI doesn't. Waist-to-height ratio: keep the waist under half the height; it travels across ages and builds better than almost any single metric. Resting blood pressure, fasting glucose/HbA1c, and a lipid panel: a few thousand rupees at any lab annually; these are the outcomes weight is merely a proxy for, and plenty of "normal BMI" South Asians carry abnormal numbers here — the whole reason the proxy needs auditing. Functional markers: stairs without breathlessness, grip strength, sleep quality — crude, free, and startlingly predictive. The sensible annual routine: weight and BMI (via the calculator), waist, blood work, and a doctor's eyes on the trends together. In that panel, the formula weights of Devine and company retire to their proper role — historical trivia — while your actual health gets measured by things that measure it.